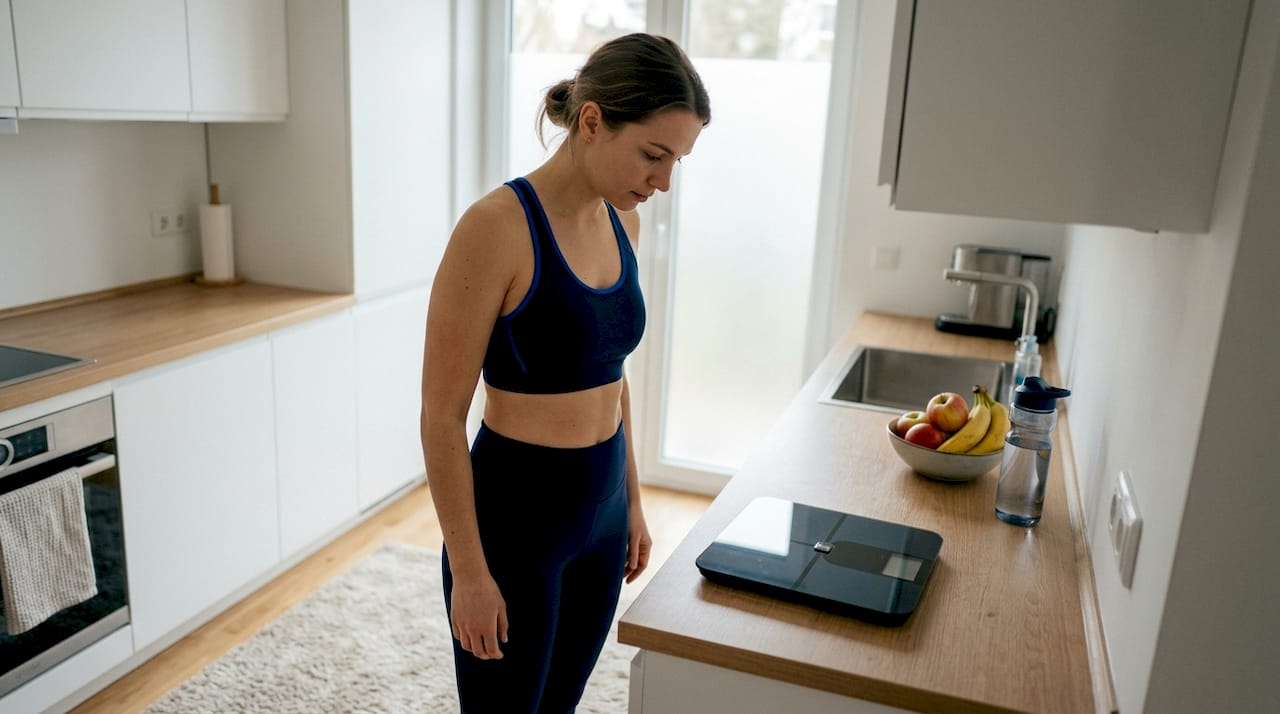
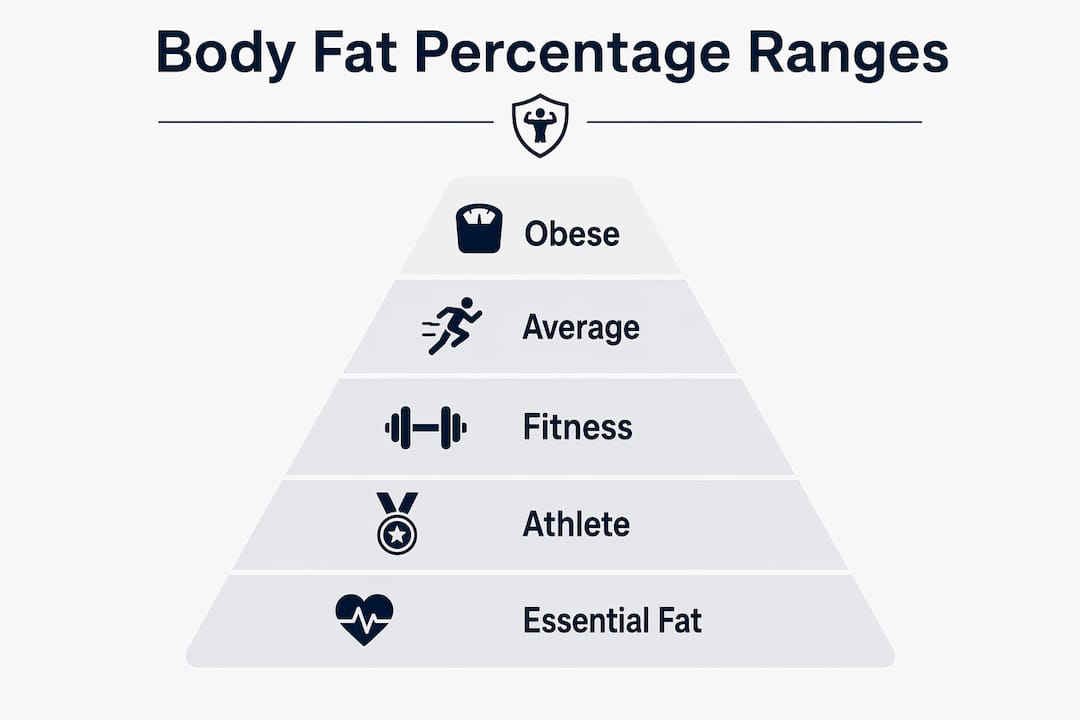
Body fat percentage is defined as the proportion of your total body weight made up of fat tissue. The American Council on Exercise (ACE) classifies female body fat into five categories: essential fat 10–13%, athlete 14–20%, fitness 21–24%, average 25–31%, and obese at 32% and above. A body fat percentage chart for women is not a single fixed target. It shifts with age, hormonal status, and fitness level, which means a number that looks “normal” on paper may carry very different health implications depending on where you are in life.
What are the healthy body fat percentage ranges for women by age?
Healthy body fat ranges for women increase with age. This is not a failure of discipline. It reflects real physiological changes, including shifts in muscle mass, bone density, and hormonal output that happen across every decade of adult life.
The ACE framework provides a useful starting point, but age-specific ranges give a more accurate picture. Fitness-range body fat for women aged 20–39 sits at 21–24%, while the same fitness category expands to 22–30% for women aged 60–79. That 6-point shift reflects decades of physiological change, not a lowered standard.

| Age group | Essential fat | Athlete | Fitness | Average | Obese |
|---|---|---|---|---|---|
| 20–39 | 10–13% | 14–20% | 21–24% | 25–31% | 32%+ |
| 40–59 | 10–13% | 14–21% | 22–27% | 28–32% | 33%+ |
| 60–79 | 10–13% | 14–22% | 22–30% | 31–35% | 36%+ |
Pro Tip: If you are 45 and reading 28% body fat on a scale, that number sits in the average range for your age group. At 25, the same reading would be at the high end of average. Always read your number against your age bracket, not a generic chart.
Postmenopausal hormonal changes cause fat to redistribute toward the abdomen, raising total body fat percentage naturally. This shift is not cosmetic. Abdominal fat accumulation after menopause carries real metabolic consequences, which is why age context matters so much when reading any body fat number.
Essential fat, the 10–13% floor for women, is the minimum required for hormonal function, reproductive health, and basic organ protection. Dropping below this threshold disrupts menstruation, bone density, and immune response. Athletes who compete in weight-class or aesthetic sports face this risk most often.
How does body fat percentage relate to health risks for women?
Cardiometabolic risk begins rising as body fat exceeds roughly 25–27% in women. That threshold sits at the lower boundary of the ACE “average” category. This means average, by clinical standards, is not the same as healthy.
The fitness category (21–24% for women aged 20–39) is the range most associated with reduced metabolic and cardiovascular risk. Women in this range tend to show better insulin sensitivity, lower triglycerides, and healthier blood pressure profiles than those in the average range.
The distinction between “statistically normal” and “clinically optimal” is one of the most misunderstood points in women’s health. A 30% body fat reading in a 35-year-old woman sits in the average ACE category. It is common. It is not optimal. Research places the lower bound of elevated cardiometabolic risk at 25–27%, meaning a woman at 30% body fat is already in a zone where metabolic risk is measurably higher than it would be at 23%.
Three key health implications of body fat level in women:
- Visceral fat matters more than total fat. Fat distribution around abdominal organs is more predictive of health risk than total body fat percentage alone. Two women at 32% body fat can have very different risk profiles depending on where that fat sits.
- The average range carries real risk. Women at 25–31% body fat are not in a danger zone, but they are not in a protective zone either. The fitness range is where risk reduction becomes measurable.
- Visceral fat accumulation is a key driver of metabolic disease. Total body fat percentage without fat distribution data can understate health risks for some women, particularly those who carry weight centrally.
A woman at 33–34% body fat sits in the obese category by ACE standards, regardless of how she looks or feels. That classification exists because the research linking that fat level to metabolic disease is consistent across populations.
What measurement methods assess body fat percentage accurately?
Not all body fat measurements are equal. The method you use determines how much you can trust the number you get.
The four most common methods, ranked by clinical reliability:
- DEXA scan. DEXA is the clinical gold standard for body fat measurement. It measures lean mass, fat mass, and bone density by region, giving a complete body composition picture that no field method can match. Dexa’s platform at dexa.report explains exactly what each scan measures and how to read regional fat data.
- Hydrostatic weighing. Also called underwater weighing, this method is highly accurate but requires specialized equipment and is rarely available outside research settings.
- Skinfold calipers. Accuracy depends heavily on the technician’s skill. Results can vary significantly between practitioners, making it unreliable for tracking changes over time.
- Bioelectrical impedance analysis (BIA). BIA devices, including most consumer smart scales, can vary by 3–5% based on hydration, food intake, and recent exercise. That margin of error is large enough to push a reading from the fitness category into the average category on a bad day.
Pro Tip: If you use a BIA scale, always measure at the same time of day, before eating, and after a consistent sleep schedule. This reduces variability and makes your trend data more reliable.
The method matters because a 3–5% swing in BIA results can completely change which ACE category your number falls into. A woman who reads 24% on a well-hydrated morning might read 27–28% after a salty dinner. Neither number is wrong, but neither is fully reliable without context.
How should women track and use body fat data for health goals?
A single body fat reading is a snapshot. Trends over time are the actual story. Tracking body fat trends combined with waist circumference and waist-to-height ratio gives a far more accurate health risk profile than any one number.
Practical steps for using body fat data well:
- Measure consistently. Use the same method, same time of day, and same conditions every time. Consistency in method matters more than method accuracy when tracking change.
- Add waist circumference. Combining body fat percentage with waist circumference provides a more complete health risk picture. A waist above 35 inches in women signals elevated visceral fat risk, regardless of total body fat percentage.
- Track quarterly, not weekly. Body fat percentage fluctuates daily with hydration and hormonal cycles. Monthly or quarterly measurements reduce noise and reveal real trends.
- Account for hormonal shifts. Women in perimenopause or postmenopause should expect their body fat percentage to rise naturally. The goal is not to fight that number back to a 25-year-old baseline. The goal is to stay within the fitness range for your age group.
- Pair data with lifestyle markers. Resting heart rate, energy levels, strength, and sleep quality tell you as much about your health as a body fat number. Use them together.
Hormonal fluctuations and age-related fat changes make a strong case for tracking multiple measurements over time rather than reacting to a single reading. One scan or one scale reading is not a verdict. A six-month trend is.
The lifestyle factors that most reliably move women from the average range toward the fitness range are resistance training, adequate protein intake, and consistent sleep. Cardio alone rarely shifts body fat percentage significantly without those two anchors in place.
Key Takeaways
A body fat percentage chart for women is most useful when read against your age group and paired with fat distribution data, not treated as a single universal target.
| Point | Details |
|---|---|
| ACE categories define the standard | Five ranges (essential, athlete, fitness, average, obese) set the clinical baseline for women’s body fat. |
| Ranges shift with age | Fitness-range body fat expands from 21–24% at age 20–39 to 22–30% at age 60–79. |
| Average is not optimal | Cardiometabolic risk rises above 25–27%, placing much of the “average” ACE range in elevated-risk territory. |
| DEXA gives the most complete picture | DEXA scans measure regional fat, lean mass, and bone density with accuracy that BIA and calipers cannot match. |
| Track trends, not single readings | Quarterly measurements combined with waist circumference reveal real health changes better than any one number. |
What the numbers actually tell you (and what they don’t)
I have seen women obsess over hitting 25% body fat as if it were a finish line. The number is not the point. What the number represents is the point.
A woman at 25% body fat with high visceral fat and poor sleep is at greater metabolic risk than a woman at 28% with low visceral fat, strong muscle mass, and consistent training. The ACE chart gives you a framework, not a verdict. The mistake most women make is treating the average category as acceptable because it sounds neutral. It is not. “Average” in this context means statistically common in the current population. It does not mean healthy.
Age context is the other piece most people skip. A 33% reading in a 62-year-old woman sits in a different clinical position than the same reading in a 28-year-old. The chart accounts for this. Most online calculators do not. If you are postmenopausal and your body fat has crept up despite consistent effort, that is physiology, not failure. The goal is to stay within the fitness range for your decade, not to chase a number from your 30s.
The most grounded approach I have seen women take is this: get an accurate baseline from a DEXA scan, track waist circumference monthly, and reassess body fat every three to six months. That rhythm gives you real data without the daily noise of a BIA scale.
— Jan
Accurate body composition data, without the guesswork
Understanding your body fat category is one thing. Knowing exactly where your fat sits, how your lean mass compares to your age group, and whether your numbers are moving in the right direction is another level entirely.

Dexa turns your DEXA scan PDF into a personal dashboard that tracks body fat, lean mass, and bone density over time. Every result is stored securely in the EU, accessible only to you, and presented in plain language you can actually use. Whether you are working toward the fitness category or monitoring changes through perimenopause, Dexa’s scan tracker gives you the trend data that a single number never can. For a deeper look at what a scan actually measures, the DEXA scan guides at dexa.report/learn cover every metric in detail.
FAQ
What is a healthy body fat percentage for women?
The ACE fitness category, 21–24% for women aged 20–39, is the range most associated with reduced cardiometabolic risk. Healthy ranges shift upward with age, reaching 22–30% for women aged 60–79.
Is 30% body fat considered obese for women?
At 30% body fat, a woman aged 20–39 sits in the upper end of the ACE average category, not the obese range. The obese threshold begins at 32% and above for that age group. For women aged 40–59, 30% falls within the average range as well.
Is 25% body fat good for women?
At 25%, a woman aged 20–39 sits at the lower boundary of the ACE average category. It is not a fitness-range reading, but it is close to the threshold where cardiometabolic risk begins to rise, making it a meaningful target to move below.
What is the most accurate way to measure body fat percentage?
DEXA scans are the clinical gold standard for body fat measurement. They provide regional data on fat mass, lean mass, and bone density with accuracy that BIA scales and skinfold calipers cannot reliably match.
How often should women measure their body fat percentage?
Quarterly measurements give enough time for real changes to show up while filtering out daily fluctuations from hydration and hormonal cycles. Pairing body fat readings with monthly waist circumference measurements gives the most complete picture of health trends.